
 As I pointed out yesterday, two papers were added to the journal Icarus's Articles in Press. The first that I want to summarize here is titled, "Io's Dayside SO2 Atmosphere." The authors of this paper are Lori M. Feaga, Melissa McGrath, and Paul D. Feldman. The authors of this paper examined far-ultraviolet data acquired by the STIS instrument on the Hubble Space Telescope between 1997 and 2001 to see what this dataset can tell us about the density of Io's atmosphere and how it varies across Io's disk.
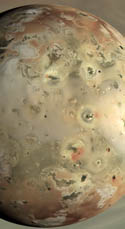
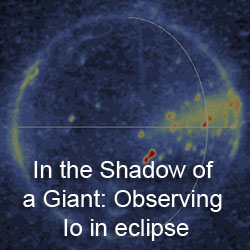
During the Galileo mission, the Hubble Space Telescope was tasked at various times between 1997 and 2001 with observing Io during the telescope's Space Telescope Imaging Spectrograph (HST/STIS). Feaga et al. took a look at the data in the range of the HI Lyman-α line (around 1216 Å or 121.6 nm) and studied the spatial and temporal variations of that spectral line's emission from Io's surface. This research builds on previous work by Feldman et al. 2000 that found that the level of emission in this far-ultraviolet spectral line is related to the column density of the atmosphere. Gaseous sulfur dioxide is a continuum absorber in this region of the spectrum, so as the column density of the SO2 in Io's atmosphere increases, less of the Lyman-α emission from the sun reaches the surface and is reflected back into space for the HST to observe it. Looking at an example image above, the dark regions on Io's disk (marked by the white circle) are places where Io's atmospheric SO2 is densest and bright areas are where gaseous SO2 is less dense. Feldman et al. 2000 found that Lyman-α emission from Io peaks at the satellite's mid-latitudes and is lowest within the equatorial region, suggesting a latitudinal dependence on the density of Io's atmosphere.
This new paper by Feaga et al. continues the research started in the 2000 paper by looking at the more complete HST/STIS dataset covering a greater longitude range than the earlier work by Feldman et al. This allowed the authors to look into spatial and temporal variations in the SO2 column density. The authors found that Io's atmosphere, in addition to the latitudinal dependence also seen in the earlier work, was densest and had the greatest latitudinal extent on Io's anti-Jovian hemisphere (particularly at the longitude range of Bosphorus Regio) and was narrower in latitudinal extent and less dense on Io's sub-jovian hemisphere. The greatest SO2 column density was seen near 140° at 5 x 1016 cm-2. However, they do note some limitations for their method for deriving SO2 column densities. For example, the densities near the equator are often high enough that the amount of signal from the surface is quite low, low enough to be effected by some of their data reduction procedures, such as removing the Lyman-α emission from the interplanetary medium and removing the effect of albedo variations on Io's surface (their albedo map comes from a nearby wavelength range and was scaled to the extected brightness range expected at 1216 Å). They found few examples of major changes in the density and extent of Io's atmosphere, suggesting that the atmosphere is stable over periods of five years or more.
The authors also looked at how their gaseous SO2 map with the distribution of volcanic hot spots and plumes as well as the distribution of sulfur dioxide frost on Io's surface as found by Doute et al. 2001. They argue that from these comparisons that their results best support a volcanically-driven atmosphere, as the equatorial and anti-jovian concentrations of gaseous SO2 is best comparable with their map of hotspots and plumes. However, it should be noted that their map is still consistent with the distribution of large-grained SO2 as found by Laver and de Pater 2009. In a sublimation-driven atmosphere, SO2 frost in the warmest regions of Io (the equatorial regions) would be the source, so the Laver and de Pater map maybe more relevent for comparison. In addition, in a volcanically-driven atmosphere, I would have expected more examples of changes as the result of variations in volcanic activity, though a few possible examples were found at Pele and Prometheus.
Finally, the authors looked at how their data compares to other measurements made by other researchers. They found that their distribution map is similar to what others have found with Io's anti-jovian hemisphere having a greater latitudinal extent and column densities of SO2 gas than the sub-jovian hemisphere and with greater SO2 column densities near the equator compared to the mid-latitudes and polar regions. They found that column density numbers, particularly in the equatorial regions, tended to be lower than other authors, such as Jessup et al. 2004 and Moullet et al. 2008. The authors suggest that the low signal-to-noise ratio within the equatorial region may make some of the measurements lower limits, though they may not be consistent with some results from Spencer et al. 2005, which predicts much higher column densities at mid-latitudes than what was found in the HST/STIS data.
Link: Io's Dayside SO2 Atmosphere [dx.doi.org]


No comments:
Post a Comment