
 In November, the paper "Multi-wavelength simulations of atmospheric radiation from Io with a 3-D spherical-shell backward Monte Carlo radiative transfer model" was published in press in the journal Icarus. The authors for this paper are Sergey Gratiy, Andrew Walker, Deborah Levin, David Goldstein, Philip Varghese, Laurence Trafton, and Chris Moore. This paper takes a look at a computer model of Io's atmosphere, consisting of a composite of sublimation and volcanic sources and published in Walker et al. (submitted to Icarus but not yet available online), and attempts to validate the model by comparing simulated observation derived from the model to real observations published over the last decade. I have to admit that this paper covers a topic that is definitely out of my wheelhouse, so I may not cover the findings of this paper with as much depth as I have given to other papers recently, but I will do the best I can to provide a summary.
While I have not read the Walker et al. paper covering the details of this new model since it hasn't been accepted by Icarus and posted online, according to this paper, it is a 3-D global rarefied gas dynamics model that uses both volcanic plumes and sublimation of surface sulfur dioxide (SO2) frost as sources for the gas in Io's atmosphere. The model takes into account changes to the column density of the atmosphere as a result to time-of-day changes to the surface temperature, distribution of SO2 surface frost, distribution of volcanic plumes (though they use persistent volcanic thermal hotspots as plume sites rather than confirmed plume locations or the locations of large surface changes), plasma heating from Jupiter's magnetosphere, and heat loss to space. For this paper, the authors used a backward monte carlo method to simulate how their model atmosphere would appear in different types of observations.
In Gratiy et al. 2009, the authors compared their model results to three observations: disk-integrated, high-spectral resolution measurements in the mid-infrared near 19-µm published by Spencer et al. 2005; disk-resolved, far-ultraviolet observations in the hydrogen Lyman-α band published in Feldman et al. 2000; and disk-integrated, millimeter wavelength observations published in Io After Galileo in the Io's Atmosphere chapter by Lellouch et al.
 First, the authors compared their model output to observations published in Spencer et al. 2005. For that paper, Spencer observed 16 SO2 ν2 vibrational band absorption lines using the TEXES mid-infrared spectrometer at the NASA Infrared Telescope Facility. This was disk-integrated spectra centered around 19 microns. From this data, the authors found a significant longitudinal asymmetry in absorption band depth, a measure of the average column density over the hemisphere sampled, with a low band depth (1%) compared to the continuum level at 315°W (the hemisphere centered near Ra and Loki) and a much stronger bands (7%) at 180°W (the hemisphere centered near Colchis Regio). This indicates that Io's atmosphere is denser over the anti-Jupiter hemisphere than over the hemisphere centered on Ra and Loki. This distribution correlates to the distribution of surface frost, but it also correlates with the distribution of volcanic plumes, as Gratiy et al. notes. The authors of this new paper found that a combined model with sublimation and volcanic sources with long residence times (5000 seconds) for condensed SO2 on bare rock. They also note that their model and the data from Spencer et al. seem to support a thermal lag where the surface temperature and thus frost sublimation peaks 3.5 hours, or 30° of rotation, after local noon. This is akin to the terrestrial experience of the air temperature being warmer in the mid- to late-afternoon, as opposed to right at noon when the sun is at its highest point in the sky. However, if you look at the PPR day-side data from I31, shown at right from Rathbun et al. 2004, there maybe some question of whether that thermal lag is real.
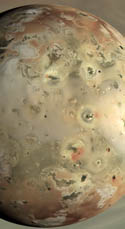
The next dataset the authors compared their model to was the Lyman-α data disk-resolved observations published in Feldman et al. 2000 and Feaga et al. 2009 (the latter paper was discussed here last year). This data was acquired using the Space Telescope Imaging Spectrograph (STIS) on Hubble between 1997 and 2001.At these far ultraviolet wavelengths, areas where Io's atmosphere are denser absorb sunlight, appear dark in Lyman-α images. Sunlight is better able to reach the surface and reflect back into space in order to be seen by Hubble. Thus, areas where Io's atmosphere is thinner appear brighter in Lyman-α images. An example of one of these images is shown at top. Gratiy et al. could not reproduce this data with their model, suggesting that they do not properly simulate the latitudinal variation in the column density of Io's atmosphere (thicker at the equator, thinner at the mid-latitudes and poles). In particular, they had difficulty reconciling the observed sharp increase in Lyman-α brightness, and therefore the sharp decrease in atmospheric column density, 45° North or South of the equator, and with the utter lack of atmosphere beyond 60° North or South latitude. This cutoff, the authors suggest, is more consistent with the distribution of surface changes and volcanic hotspots, as opposed to surface frost. However, there don't seem to be variations in the Lyman-α images resulting from known volcanic plumes. The lack of an east-west asymmetry on either side of the central meridian in Io's equatorial brightness in the far-ultraviolet data that would be expected from the Walker et al. model suggests that the surface thermal inertia is much lower than they used for that model.
In the final comparison, Gratiy et al. compared their model to disk-integrated millimeter-wave SO2 emission line profiles obtained at IRAM 30-meter telescope in Spain, published in Io After Galileo in the Io's Atmosphere chapter by Lellouch et al. and disk-resolved data in Moullet et al. 2008. The authors determined that strong atmospheric winds explain the wider SO2 emission lines in the IRAM data compared to what would be expected from thermal Doppler effects alone.
To be honest, this was a difficult paper for me to get through, hence why it took a month and a half for me to get this summary up. So, I apologize for not explaining the paper's conclusions as well as I could have. Basically, the authors hope that by comparing their rarefied gas dynamics model of Io's atmosphere with real observations they can make some improvements to that model that also provide new information about Io, such as the presence and strength of atmospheric winds, the surface thermal inertia, and the relative contribution of frost sublimation and volcanic plumes to Io's atmosphere.
Link: Multi-wavelength simulations of atmospheric radiation from Io with a 3-D spherical-shell backward Monte Carlo radiative transfer model [dx.doi.org]


No comments:
Post a Comment